02/15—67091—1527
02/14—64447—1384
02/13—60347—1369
02/12—45214—1116
02/11—43129—1018
02/10—40573—-910
02/09—37590—-814
02/08—34944—-725
02/07—31523—-638
02/06—28276—-565
02/05—24554—-492
02/04—20679—-427
02/03—17046—-362
02/02—14628—-305
01/02—11374—-259
31/01—-9821—-213
30/01—-8235—-171
29/01—-7783—-170
28/01—-6057—-132
27/01—-4231—-103
26/01—-2808—–80
25/01—-2117—–56
24/01—-1126—–41
23/01—–901—–26
22/01—–651—–25
21/01—–317——6
20/01—–219——4
19/01—–204——3
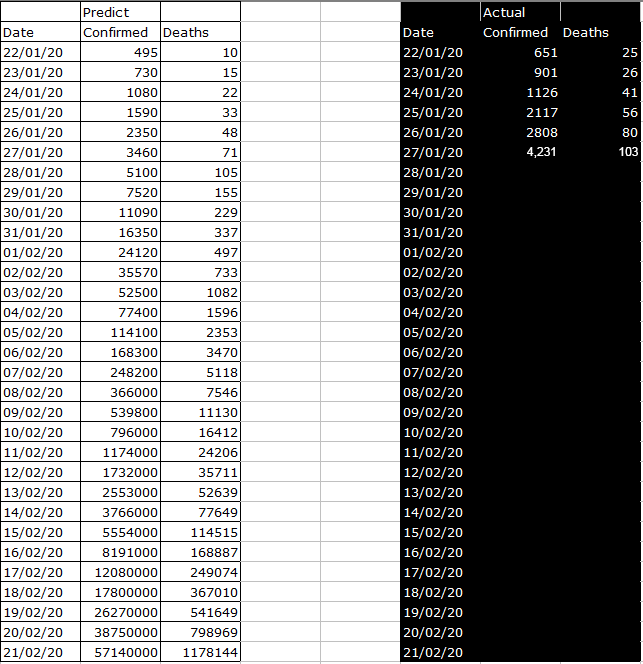
Spreadsheet image courtesy of Anonymous Conservative. There may actually be some good news here, as the current numbers out of Johns Hopkins, as of end of day 28/01/20, are 6,057 and 132, which, while still ahead of the predicted model, may indicate that the transmission rate is slowing down a little, from 22 percent over to 18 percent over, while the death rate has declined from 45 percent over to 25 percent over. However, it’s still too soon to reach any meaningful conclusion.
It’s important not to overreact to these statistical models, as you may recall that the Ebola outbreak of 2014 doubled every 4.4 weeks, but the infection rate finally declined and broke the curve in the 9th doubling cycle. So, to know when the coronavirus outbreak is beginning to burn itself out, look for the doubling rate to slow down from its current rate of just over two days.
Alternatively, if it picks up, you may do well to start paying attention to the possibility Corona-chan will be making an appearance closer to you than you might like.