The $52 trillion question

This is a graph of the four primary debt sectors from 2008 through Q3 2010, which between them account for 90% of the total credit market debt outstanding in the USA.  The red line represents the total of federal debt plus state and local debt; $9 trillion belongs to the federal government while $2.4 trillion is owed by the state and local governments.

So, while Z1 reports a quarterly increase of 0.43% in overall credit, the first increase after five straight negative quarters, this meager increase almost entirely consists of swapping financial sector debt for federal government sector debt.  This is consistent with what I described was likely to happen in The Return of the Great Depression and is also consistent with the Misean definition of inflation that includes credit as opposed to the Friedmanite one that does not.  The $52 trillion question is how long this debt transference process can be maintained.  If it can go on indefinitely, then there will eventually be hyperinflation.  If it cannot, there will be deflation.  High metal prices notwithstanding, I still maintain that it cannot go on indefinitely, and the fact that the Fed and the Treasury are limiting their credit expansion to approximately the level of the private sector credit contraction tends to suggest that this is the case.  Three years is impressive, but it is neither infinite nor conclusive.

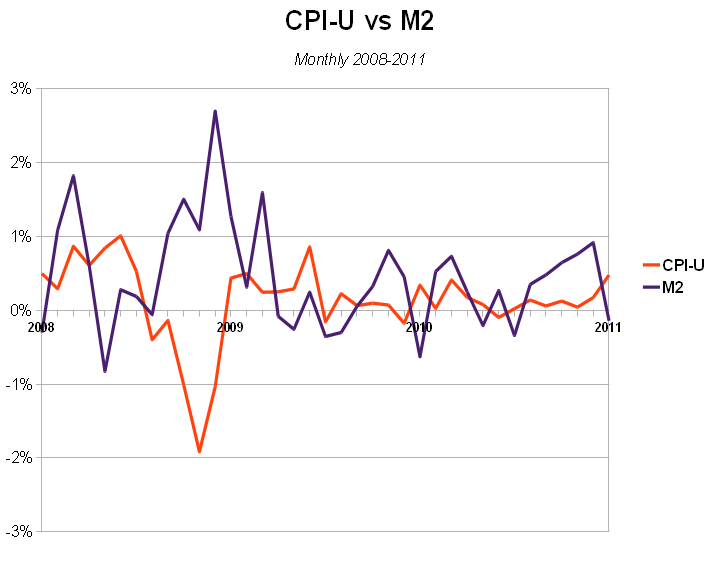
I don’t deny that we have seen what looks like inflation due to the steady increase in M1 and M2.  But keep in mind that we know beyond any shadow of a doubt that the mortgage banks have not been accurately accounting for the bad debts being incurred by defaulting homeowners and that they may not even hold title to many of the homes that supposedly back  those home loans.  This means that the yellow line should be declining more rapidly than it is.  Also, we know that the insolvent nature of many of the large financial institutions means that the light blue line is going to decline dramatically once the first one fails and sets off the chain reaction that the Fed has been so desperately attempting to forestall.  Those debts are not going to be inflated away, they are going to be deleveraged through default as has been happening on a smaller $3.1 trillion scale since the 4th quarter of 2008.

Since the government now accounts for 21.8% of all debt, up from 14.6% in only 27 months, the government looks to be facing a choice between assuming ownership of all debts owed in the economy within two decades or to stop fighting the deflationary process that Austrian theory dictates is not only necessary, but inevitable.  Those looking to the historical example of the Great Depression should keep in mind that the federal government had a good deal more leeway at that time because it was not already saddled with one-fifth of the debt in the economy.  And don’t forget, this accounting doesn’t include the very large debts imposed by off-budget pension plans at the state and local level and entitlements at the federal level.


Default and devalue

Iceland shows that the arguments put forth by the banksters and the europhiles are simply incorrect:

Iceland’s real gross domestic product grew by 1.2 percent in the July-September period from the previous quarter, the first quarterly increase since the same period in 2008. Iceland entered a slump after its overleveraged financial sector collapsed in the wake of Lehman Brothers’ bankruptcy.

Like Ireland and Greece, Iceland has taken a large dose of austerity measures to rebuild its economy. Unlike Ireland and Greece, however, Iceland allowed private banks to fail, and its currency, the krona, has declined by about 46 percent against the dollar since the start of 2008.

“Excluding the financial system, the real economy is doing well,” Arsaell Valfells, a professor of business and finance at the University of Iceland, said in telephone interview. Retail spending was still shrinking, he said, but the export sector, consisting mainly of fish, aluminum and tourism, was improving.

Just as a man cannot serve two masters, a government cannot serve two economies. The USA and Europe have chosen to preserve the financial economy at the cost of the real economy. Iceland chose the opposite. Needless to say, Iceland made the wiser choice because there are a lot more people in the real economy than the financial one. More importantly, the real economy is not a parasite completely dependent upon the financial economy, which is why putting the interests of the financial economy first is bound to be disastrous when viewed from a longer term perspective.


The Fifth Definition

Paul Krugman explains why Keynesian economists have now begun to switch to a fifth definition of inflation, “core inflation”, that is distinct and increasingly distant from the Keynesian school’s theoretical, official, textbook, and practical definitions.

Since I’m taking a break from shoveling, I thought I might take a few minutes to address an issue that seems to confuse many people: the idea of core inflation. Why do we need such a concept, and how should it be measured? So: core inflation is usually measured by taking food and energy out of the price index; but there are alternative measures, like trimmed-mean and median inflation, which are getting increasing attention.

First, let me clear up a couple of misconceptions. Core inflation is not used for things like calculating cost-of-living adjustments for Social Security; those use the regular CPI.  And people who say things like “That’s a stupid concept — people have to spend money on food and gas, so they should be in your inflation measures” are missing the point. Core inflation isn’t supposed to measure the cost of living, it’s supposed to measure something else: inflation inertia….

The standard [core inflation] measure tries to do this by excluding the obviously non-inertial prices: food and energy. But are they the whole story? Of course not — and standard core measures have been behaving a bit erratically lately. Hence the growing preference among many economists for measures like medians and trimmed means, which exclude prices that move by a lot in any given month, presumably therefore isolating the prices that move sluggishly, which is what we want.

And then these great minds of the dismal science wonder why their models don’t work in either a predictive or an explanatory manner. Of course, the reason they need to keep coming up with these additional “definitions” is because not because the “measures have been behaving a bit erratically” but because the conclusions that are based on the definitions don’t line up with what is visibly taking place in the actual economy.

The red line is the standard “core inflation” CPI-FLENS measure that Krugman is citing in his second “Core Logic” post; the blue line is the standard CPI-U.  However CPI-FLENS cannot possibly measure the inflation inertia because the practical application of the various Keynesian definitions of inflation requires something to measure those price changes against.  Simply removing some of the more volatile (and generally higher) prices from the price index only smooths out the price index while tending to reduce it.  Since inflation – and therefore its inertia – depends upon the comparison of those price changes with changes in the production of goods and services, (in practical terms, with GDP minus the price increase of one’s preferred index, be it CPI-U or CPI-FLENS), anything that leaves GDP out of the equation cannot be considered the inflation inertia anymore than the mere change in prices can be considered inflation if it does not take the change in production into account.


So much for inflation

Apparently QE III is in the cards:

In an effort to thwart counterfeiting, the US Government has implemented a $100 bill design so difficult to print even the U.S. Treasury cannot print them. The government needs to burn $110 billion in flawed $100 bills, more than 10% of all existing cash. The cost of printing the flawed bills was a mere $120 million.

If inflation is derived from the money supply, then burning 10% of the the entire currency stock should cause prices to fall, right? Given the current M2 figure of $8,767 billion, this bonfire of the Franklins should result in an immediate 1.3% reduction in the rate of inflation.


Voxiversity 5.2: Inflation and Keynesian Economics

This should be an interesting discussion. The conclusion will initially strike some as a priori insane, but I encourage everyone to consider the empirical evidence before issuing a diagnosis. I may need to revisit this one after the critics have shared their presumably constructive input, so I look forward to hearing everyone’s take on it.

In case you’re wondering why these esoteric and pedantic debates over definitions are of interest to me or why they are important, consider this recent interview with Ben Bernanke. The relevant statement is highlighted in bold.

Pelley: Some people think the $600 billion is a terrible idea.

Bernanke: Well, I know some people think that but what they are doing is they’re looking at some of the risks and uncertainties with doing this policy action but what I think they’re not doing is looking at the risk of not acting.

Pelley: Many people believe that could be highly inflationary. That it’s a dangerous thing to try.

Bernanke: Well, this fear of inflation, I think is way overstated. We’ve looked at it very, very carefully. We’ve analyzed it every which way. One myth that’s out there is that what we’re doing is printing money. We’re not printing money. The amount of currency in circulation is not changing. The money supply is not changing in any significant way. What we’re doing is lowing interest rates by buying Treasury securities. And by lowering interest rates, we hope to stimulate the economy to grow faster. So, the trick is to find the appropriate moment when to begin to unwind this policy. And that’s what we’re gonna do.”

It should be clear that the Fed Chairman does not define inflation in any of the Keynesian manners described in this video. But is his definition correct? That is the $600 billion question.


Let the women work

Calculated Risk presents a chart showing that the percentage of men aged 25-54 participating in the labor force declined to a record low of 88.8% in November.  And that was BEFORE the release of the new World of Warcraft expansion.  The chart goes back to 1948 and shows that the idea women first entered the workforce en masse after WWII or in the 1970s simply isn’t true; about one-third of women have always had to work.  The increase in the percentage of women participating in the workforce is predominantly the result of young women who previously got married and had children while being supported by a husband now working instead of or in addition to having a family.  The chart is also a little misleading in that it only measures to age 54.  One of the chief impacts of more women entering the workforce is that men over the age of 60, who had previously been much more inclined to work, exited the workforce en masse thanks to the establishment of Social Security and Medicare.

So, as I have often said, the primary benefit to society from employing young women is to pay for old men collecting retirement.  In return for which the societal costs include declining marriage rates, skyrocketing illegitimacy rates, lower average wages for both men and women, reduced productivity, and demographic decline.  This would not appear to be either a rational or sustainable policy for any nation, especially considering that the first attempted solution, importing third-world workers to replace the missing children, has not worked out well for any nation that has adopted it.  The choice is as stark as it is simple.  Either abandon the notion of sexual equality and return to the traditional model where 70% of women are occupied with raising families or experience complete societal collapse.

On a tangential note, I saw this in the comment’s at CR’s place.  I don’t see it as a positive indicator: A friend picked up a hitch-hiker in the National Park last week and gave him a ride, and it turned out he was a marine that had done 3 tours in the sandbox, but apparently our military is getting picky about who they allow to re-up, and he told my friend, “I hope something happens in Korea, so I can go back to work.”  It is a time-honored fact of history that when men cannot find jobs, the rulers of society attempt to keep them occupied killing people somewhere else.


Low hurdles

I was bemused when I checked Channel Vox this morning preparatory to uploading the next video in the inflation series and saw that it had won a YouTube award. It appears Voxiversity was #3 Most Subscribed Channel in Italia this week. Of course, I would have needed 360x more to have reached the same ranking in the USA. Clearly the next video should be entitled Victoria’s Secret Economics: Alessandra Ambrosio Explains Inflation.

But since I’m on the subject, I should mention there is a slight change of plans with regards to the 5.2 video. I am extremely loathe to make a case that depends upon anyone accepting my assertions undemonstrated, so the second video will not concern the credit-money definition of inflation as I’d originally planned, but will instead demonstrate the inutility of the four – yes, four – primary Keynesian definitions of inflation. The third video will examine the Monetarist definition, and only then, once the case against the various mainstream definitions is concluded, will I explain and defend my contention that the correct definition of inflation is an increase in the money supply plus outstanding debt.

Anyhow, I’m planning to do the recording tonight and upload it sometime this weekend, in case you’re interested.


Let’s try this again

I think it’s better this time. I’m getting more familiar with Camtasia, which tends to help, and the volume is significantly louder. I also managed to utilize the full screen this time instead of inadvertantly leaving a black rectangle around the perimeter. I also introduced minor errors into two of the graphs; the CPI recalculated for the 0.6% annual error only shows a line including a recalculation for the last ten years and the labels for the dollar devaluation chart were cut off, but I’ve decided to leave it as is so that I can move on to the next one. I found a better font to use for the pop-up notes as well, or “call-outs” as Camtasia calls them.

As before, suggestions for improvement would be welcome. The next video will address why inflation has to include outstanding debt; after that I plan to do videos examining the two conventional definitions of inflation. If you’re interested in being notified when new videos are uploaded, you can subscribe to the Voxiversity Channel.


And the media is right on time

You may recall that in RGD, I wrote that the mainstream media would begin seriously throwing around references to the Great Depression before the end of 2010:

This is starting to throw off more echoes of the Great Depression, where you have a sequence of crises, each touched off by the ones that came before, like dominos falling into some diabolic design. Europe and America thought they’d seen the worst of things by the end of 1930, only to be knocked back down even harder by the contagion of the Creditanstalt crisis. In the US, the crisis ultimately triggered a string of bank failures worse than those sparked by the initial stock market crash, and the worst two years of the Great Depression were 1932-3.

I don’t want to lean too hard on this, as economic commentators (maybe including me) have started seeing Creditanstalt everywhere–in Dubai, in Greece, now in Ireland and maybe Spain. It’s entirely possible that we’ll eventually muddle through without a second major event. But it’s worth remembering that these things take a long time to unfold, and that we are often most vulnerable just when we think we have time for a breather.

The difference, of course, is that the Great Depression 2.0 is going to be much wider, and probably somewhat deeper, than its predecessor. The main reason is that the last time, only the USA attempted to fight it with major government intervention. This time, practically all the governments around the world are doing so. I’m a little off in terms of the timeline since the depression has not been publicly recognized yet, but I have no doubts that we are in it already.


The opportunity cost of sex

Since Spacebunny mentioned that the previous post was of the sort to cause most people to feign death rather than risk inadvertantly entering into the discussion, I thought I’d post Susan Walsh’s rather different take on the opportunity cost study. I suspect it is much more likely to prove interesting to the non-economists in our midst. Not that pedantic debates over opportunity cost versus net utility calculations aren’t stone cold sexy, you understand.

One of the most valuable key economic concepts is that of opportunity cost. It’s the cost of not choosing something, the benefits left behind on the road not taken, and it’s an important component of any choice you make. Sometimes the tradeoff is obvious – if you choose to date Brad, you’re giving up the opportunity to date Jonathan, for example. Often times, though, opportunity costs can be hidden, which can lead to making irrational decisions….

Women often figure they have nothing to lose by staying in a disappointing arrangement until something better comes along. This is a terrible strategy for three reasons:

It’s not just women who make this mistake. As I’ve told some of my male friends time and time again, women should not be confused with jobs. While the best way to find a new job is to have a job, the best way to find a wife is not to have a wife. If you want to meet women, you are much better off being out, about and unattached than caught up in a half-hearted relationship with a girl that you plan to trade in for someone better on the off-chance that you happen to meet them on one of the nights that you’re not sitting at home watching re-runs of Sex in the City with a woman you don’t even particularly like. It’s not fair to her and it’s not utility maximizing for you.

UPDATE: We’re not talking about pre-selection here. We’re talking about the sort of man who is in a “serious relationship” but doesn’t want to be and is simply waiting around for someone else to come along before he can break it off with her.