Daniel Indiviglio makes some relevant points in his article about the downgrade at The Atlantic and he was one of the few who correctly saw it as a real possibility, but I think he ultimately goes off-track when he calls into question S&P’s decision to downgrade the U.S. sovereign credit rating:
S&P was not happy with the $2.2 trillion minimum debt reduction plan. That’s understandable. A bigger deal would certainly have been preferable from a fiscal soundness standpoint. But does the agency really estimate that the deal is is so dangerously small that there’s a realistic chance that the U.S. could now default at some point in the future? In particular, does U.S. debt really look significantly riskier now than it did in, say, April?
The bond market certainly doesn’t think so. Treasury yields are near all-time lows, despite all that political nonsense. And remember, the interest the U.S. pays on its debt is far, far smaller than its tax revenues. If the Treasury prioritizes interest payments, then there’s no conceivable way the U.S. could default.
I defended S&P’s initial decision to put the U.S. rating on negative watch back in May when politics were becoming poisonous. But to actually downgrade the U.S. after Washington managed to avoid its self-created crisis is another story. S&P should have acted like the other agencies and affirmed the U.S. rating, but kept it on negative watch until more deficit reduction plans were put in place over the next couple of years, as I explain here.
In fact, this might not turn out well for S&P. The firm might think it’s acting boldly or proactively. Instead, the market may question S&P’s reasoning skills. The rating agency is acting here on an assumption not shared by its peers at Moody’s and Fitch: that U.S. politics are so screwed up that they could render the nation unable to live up to its debt obligations. That’s despite pretty much everyone agreeing that the nation will be financially able to pay for its debt in the short-, medium-, and long-term.
Indiviglio did a great job of demonstrating that the U.S. downgrade was be almost perfectly in line with the historical Japanese downgrade, which took place when its net government debt reached 60% of GDP. (It is presently around 225%). However, he reaches the wrong conclusion, as many have, by getting sidetracked over the way in which S&P’s analyzed the political situation in the U.S.A. And while there was never any question of short-term default, (despite the scare tactics of both Democrats and Republicans), I very much disagree that the nation will necessarily be able to pay for its debt in the medium- and long-terms.
The real reason that the downgrade was not only inevitable, but correct, and not only correct, but the first in a series of downgrades, can be seen in projections based on the historical patterns in the Z1 debt sector charts. These show the S&P’s worst case scenario to be far too optimistic to be credible.
While the debt figures don’t match up perfectly, as August “Net debt held by the public” is a little different at $9.78 trillion than Q1-2011 “federal government debt outstanding” at $9.65 trillion, they are close enough for the purposes of comparison. Utilizing the Q1 figure provides a federal debt/GDP of 64.3%, which is much lower than 74% presently estimated by the end of 2011 by S&P’s. However, we can see how they reach that number by plugging in the expected growth in the amount of debt at the post-2008 quarterly average of $365 billion. This indicates an end of year federal debt figure of 10.74 trillion and a GDP figure of $14.513 trillion.
In other words, S&P’s is probably assuming that either GDP will contract $490 million in the second through fourth quarters or the rate of federal borrowing will slow down. Either way, the so-called “double-dip recession” already appears to be baked in the S&P’s cake, assuming that its analysts are as capable of reading the Federal Reserve reports as Karl Denninger is. But that’s not the interesting aspect, from my perspective. What is interesting is the debt/GDP projections under the three future scenarios, Upside, Base Case, and Downside. Consider these projections of future federal debt to GDP ratios:
UPSIDE: 2011 74%, 2015 77%, 2021 78%
BASE CASE: 2011 74%, 2015 79%, 2021 85%
DOWNSIDE: 2011 74%, 2015 90%, 2021 101%
Where I suspect S&P’s has gone amiss, (and perhaps it had no choice in the matter due to its professional obligations), is by taking the CBO scoring figures seriously and thereby utilizing GDP estimates as the primary variable. Based on my calculations, it is also possible that S&P’s is simply plugging in the 66-year average rate of increase of federal debt, 5.92%, into their spreadsheets. But it isn’t GDP that has changed so drastically over the last three years and significantly modified the debt/GDP ratio, it is the rapid 82.89% increase in the federal debt over the last 11 quarters. If we utilize federal debt as the primary variable and plug them into S&P’s GDP estimates, we get some very different results. (I’m going to ignore the inflation and tax estimates in order to reduce the number of variables; these are estimates for the purpose of critical comparison, not predictive projections.)
The S&P’s GDP estimates are as follows:
UPSIDE: 3% GDP growth + lapsed tax cuts
BASE CASE: 3% GDP growth
DOWNSIDE: 2.5% GDP growth
However, net GDP growth over the 13 quarters from Q1 2008 to Q2 2011 is $729.9 billion, or 5.1%. That is an annual rate of growth of 1.57% and assumes that overall credit continues to remain flat at $52.6 trillion while federal debt continues to rise at the rate that private debt contracts. Call it the CURRENT CASE. Plugging in 1.57% annual GDP growth and 22.7% annual federal debt growth provides the following debt/GDP ratios if one begins with the firm numbers from the end of year 2010.
CURRENT CASE: 2011 77%, 2015 164%, 2021 509%
And if we substitute actual rates of federal debt growth for the S&P estimates of it that are based on the notoriously unreliable CBO scoring, it becomes very clear that the debt/GDP projections are wildly inaccurate regardless of what rate of GDP growth is assumed and shows that the problem is not one that economic growth can possibly solve. In fact, the revised UPSIDE case which takes historical debt growth into account is much worse than the Base Case that does not.
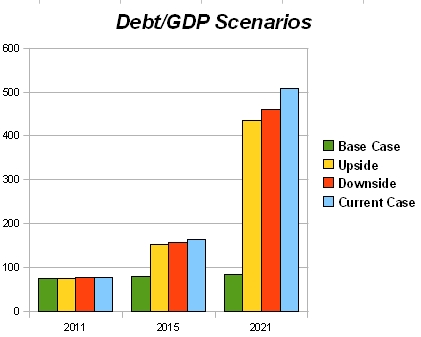
Notice that while the end of year 2011 figure (actually 76.8%) isn’t much worse than S&P’s is projecting at 74%, it is considerably worse than the DOWNSIDE in 2015 (164% vs 79%) and more than six times as bad in 2021 (509% vs 85%). But are these astronomical ratios even remotely possible? Could federal debt really rise to $26.1 trillion in 2015 from $9.6 trillion at present? After all, that would amount to 39.4% of all U.S. debt outstanding, assuming that the private sectors shrank at the same rate that the federal government sector expanded, and would indicate a Game Over default sometime in between 2016 and 2018.
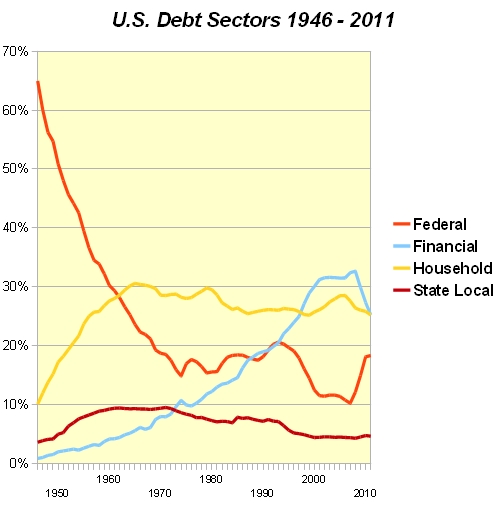
This chart, which shows the historical percentage for each of the major debt sectors since 1946, demonstrates that at least the 2015 rate is clearly within the bounds of possibility. The Federal Government sector represented more than 39.4% of total U.S. debt until 1955. Furthermore, it also shows that the decline of Financial sector debt, which has contracted $3 trillion since 2008 and fallen from 32.7% of the total to 26.8%, could conceivably continue to dwindle away to less than one percent of the total, which would amount to an additional $11.2 trillion in debt-deleveraging that would need to be replaced by federal debt in order to prevent concomitant economic contraction. (It also, by the by, shows very clearly the real source of America’s current economic woes.) Government spending and borrowing is not the root cause of the problem, it is merely a failed attempt to cure the disease of massive private sector debt expansion and contraction.
Now, I am not making any predictions here, other than a general one that because private sector debt will continue to fall, there will be tremendous pressure to continue to increase federal spending and borrowing at rates more similar to that of the last three years than the historical norm. This is because the alternative is an immediate and sizable contraction of GDP. As ugly as it appears, the CURRENT CASE scenario I have outlined is not a worst case scenario because it does not account for the economic contraction I expect to finally begin showing up in the GDP numbers later this year and in 2012. The determining factor will be whether the rate of increase of federal debt is closer to the 22.7% annual rate of 2008-2011 or the 5.9% rate of 1946-2011. Just out of curiosity, I looked at the latter, which in combination with the 1.57% 2008-2011 GDP growth produces the following scenario:
HISTORICAL CASE: 2011 66.3%, 2015 78.4%, 2021 100.9%.
Which of these five scenarios appears to be playing out should be readily apparent by the time the Q4-2011 debt sector numbers are published in the Federal Reserve’s Z1 report. If the Household and Private sectors continue to decline and end-of-year federal debt/GDP is over 75%, then CURRENT CASE is probably in effect.