The Federal Reserve said it will keep its monetary policy stimulus for “at least through mid-2013” in an effort to support a flagging economy and fragile global markets that faced considerable internal dissent.
The Fed really does appear to have a terminal case of martellus clavus. Their only hammer is a loose money supply, therefore the problem MUST be a nail. Hit it again! And by the way, for those who don’t speak Fed, this announcement of zero interest money for a minimum of two years in advance is about as close as Ben Bernanke is ever going to get to admitting that the economy is in a depression until it becomes a matter of public record.
Over the last two months, numerous political commentators, as well as leading Democrats and Republicans, have vehemently insisted that a deal on the debt ceiling was necessary to avoid debt default and credit downgrades. Unsurprisingly, these happened to be the same commentators and politicians who did not see the crisis of 2008 coming and who have swallowed whole the ludicrous claim of “economic recovery” still being pushed by the Federal Reserve and the Bureau of Economic Analysis.
And once more, all of these public Panglosses have been proven wrong by events. This time, however, it took only three days to demonstrate their observable incompetence. The downgrade of U.S. credit was inevitable because the salient issue was never the debt ceiling or the inability of the federal government to borrow more money, but rather, the fact that it was already borrowing too much.
Daniel Indiviglio makes some relevant points in his article about the downgrade at The Atlantic and he was one of the few who correctly saw it as a real possibility, but I think he ultimately goes off-track when he calls into question S&P’s decision to downgrade the U.S. sovereign credit rating:
S&P was not happy with the $2.2 trillion minimum debt reduction plan. That’s understandable. A bigger deal would certainly have been preferable from a fiscal soundness standpoint. But does the agency really estimate that the deal is is so dangerously small that there’s a realistic chance that the U.S. could now default at some point in the future? In particular, does U.S. debt really look significantly riskier now than it did in, say, April?
The bond market certainly doesn’t think so. Treasury yields are near all-time lows, despite all that political nonsense. And remember, the interest the U.S. pays on its debt is far, far smaller than its tax revenues. If the Treasury prioritizes interest payments, then there’s no conceivable way the U.S. could default.
I defended S&P’s initial decision to put the U.S. rating on negative watch back in May when politics were becoming poisonous. But to actually downgrade the U.S. after Washington managed to avoid its self-created crisis is another story. S&P should have acted like the other agencies and affirmed the U.S. rating, but kept it on negative watch until more deficit reduction plans were put in place over the next couple of years, as I explain here.
In fact, this might not turn out well for S&P. The firm might think it’s acting boldly or proactively. Instead, the market may question S&P’s reasoning skills. The rating agency is acting here on an assumption not shared by its peers at Moody’s and Fitch: that U.S. politics are so screwed up that they could render the nation unable to live up to its debt obligations. That’s despite pretty much everyone agreeing that the nation will be financially able to pay for its debt in the short-, medium-, and long-term.
Indiviglio did a great job of demonstrating that the U.S. downgrade was be almost perfectly in line with the historical Japanese downgrade, which took place when its net government debt reached 60% of GDP. (It is presently around 225%). However, he reaches the wrong conclusion, as many have, by getting sidetracked over the way in which S&P’s analyzed the political situation in the U.S.A. And while there was never any question of short-term default, (despite the scare tactics of both Democrats and Republicans), I very much disagree that the nation will necessarily be able to pay for its debt in the medium- and long-terms.
The real reason that the downgrade was not only inevitable, but correct, and not only correct, but the first in a series of downgrades, can be seen in projections based on the historical patterns in the Z1 debt sector charts. These show the S&P’s worst case scenario to be far too optimistic to be credible.
While the debt figures don’t match up perfectly, as August “Net debt held by the public” is a little different at $9.78 trillion than Q1-2011 “federal government debt outstanding” at $9.65 trillion, they are close enough for the purposes of comparison. Utilizing the Q1 figure provides a federal debt/GDP of 64.3%, which is much lower than 74% presently estimated by the end of 2011 by S&P’s. However, we can see how they reach that number by plugging in the expected growth in the amount of debt at the post-2008 quarterly average of $365 billion. This indicates an end of year federal debt figure of 10.74 trillion and a GDP figure of $14.513 trillion.
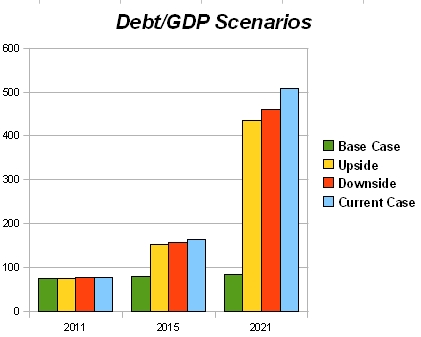
In other words, S&P’s is probably assuming that either GDP will contract $490 million in the second through fourth quarters or the rate of federal borrowing will slow down. Either way, the so-called “double-dip recession” already appears to be baked in the S&P’s cake, assuming that its analysts are as capable of reading the Federal Reserve reports as Karl Denninger is. But that’s not the interesting aspect, from my perspective. What is interesting is the debt/GDP projections under the three future scenarios, Upside, Base Case, and Downside. Consider these projections of future federal debt to GDP ratios:
Where I suspect S&P’s has gone amiss, (and perhaps it had no choice in the matter due to its professional obligations), is by taking the CBO scoring figures seriously and thereby utilizing GDP estimates as the primary variable. Based on my calculations, it is also possible that S&P’s is simply plugging in the 66-year average rate of increase of federal debt, 5.92%, into their spreadsheets. But it isn’t GDP that has changed so drastically over the last three years and significantly modified the debt/GDP ratio, it is the rapid 82.89% increase in the federal debt over the last 11 quarters. If we utilize federal debt as the primary variable and plug them into S&P’s GDP estimates, we get some very different results. (I’m going to ignore the inflation and tax estimates in order to reduce the number of variables; these are estimates for the purpose of critical comparison, not predictive projections.)
The S&P’s GDP estimates are as follows:
UPSIDE: 3% GDP growth + lapsed tax cuts BASE CASE: 3% GDP growth DOWNSIDE: 2.5% GDP growth
However, net GDP growth over the 13 quarters from Q1 2008 to Q2 2011 is $729.9 billion, or 5.1%. That is an annual rate of growth of 1.57% and assumes that overall credit continues to remain flat at $52.6 trillion while federal debt continues to rise at the rate that private debt contracts. Call it the CURRENT CASE. Plugging in 1.57% annual GDP growth and 22.7% annual federal debt growth provides the following debt/GDP ratios if one begins with the firm numbers from the end of year 2010.
CURRENT CASE: 2011 77%, 2015 164%, 2021 509%
And if we substitute actual rates of federal debt growth for the S&P estimates of it that are based on the notoriously unreliable CBO scoring, it becomes very clear that the debt/GDP projections are wildly inaccurate regardless of what rate of GDP growth is assumed and shows that the problem is not one that economic growth can possibly solve. In fact, the revised UPSIDE case which takes historical debt growth into account is much worse than the Base Case that does not.
Notice that while the end of year 2011 figure (actually 76.8%) isn’t much worse than S&P’s is projecting at 74%, it is considerably worse than the DOWNSIDE in 2015 (164% vs 79%) and more than six times as bad in 2021 (509% vs 85%). But are these astronomical ratios even remotely possible? Could federal debt really rise to $26.1 trillion in 2015 from $9.6 trillion at present? After all, that would amount to 39.4% of all U.S. debt outstanding, assuming that the private sectors shrank at the same rate that the federal government sector expanded, and would indicate a Game Over default sometime in between 2016 and 2018.
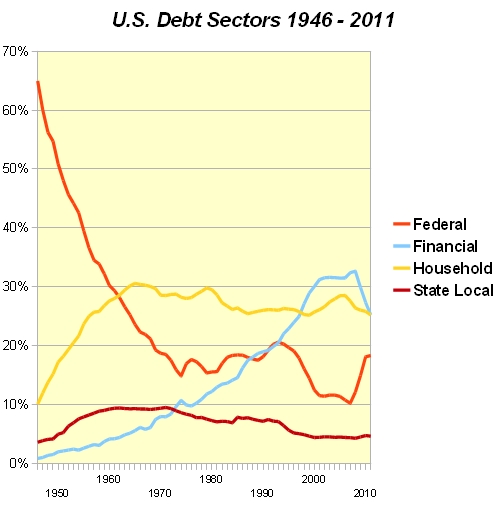
This chart, which shows the historical percentage for each of the major debt sectors since 1946, demonstrates that at least the 2015 rate is clearly within the bounds of possibility. The Federal Government sector represented more than 39.4% of total U.S. debt until 1955. Furthermore, it also shows that the decline of Financial sector debt, which has contracted $3 trillion since 2008 and fallen from 32.7% of the total to 26.8%, could conceivably continue to dwindle away to less than one percent of the total, which would amount to an additional $11.2 trillion in debt-deleveraging that would need to be replaced by federal debt in order to prevent concomitant economic contraction. (It also, by the by, shows very clearly the real source of America’s current economic woes.) Government spending and borrowing is not the root cause of the problem, it is merely a failed attempt to cure the disease of massive private sector debt expansion and contraction.
Now, I am not making any predictions here, other than a general one that because private sector debt will continue to fall, there will be tremendous pressure to continue to increase federal spending and borrowing at rates more similar to that of the last three years than the historical norm. This is because the alternative is an immediate and sizable contraction of GDP. As ugly as it appears, the CURRENT CASE scenario I have outlined is not a worst case scenario because it does not account for the economic contraction I expect to finally begin showing up in the GDP numbers later this year and in 2012. The determining factor will be whether the rate of increase of federal debt is closer to the 22.7% annual rate of 2008-2011 or the 5.9% rate of 1946-2011. Just out of curiosity, I looked at the latter, which in combination with the 1.57% 2008-2011 GDP growth produces the following scenario:
Which of these five scenarios appears to be playing out should be readily apparent by the time the Q4-2011 debt sector numbers are published in the Federal Reserve’s Z1 report. If the Household and Private sectors continue to decline and end-of-year federal debt/GDP is over 75%, then CURRENT CASE is probably in effect.
UPDATE – More like 3 in 3, I would say: “A Standard & Poor’s official says there is a 1 in 3 chance that the U.S. credit rating could be downgraded another notch if conditions erode over the next six to 24 months. The credit rating agency’s managing director, John Chambers, tells ABC’s “This Week” that if the fiscal position of the U.S. deteriorates further, or if political gridlock tightens even more, a further downgrade is possible.”
Two government officials tell ABC News that the federal government is expecting and preparing for bond rating agency Standard & Poor’s to downgrade the rating of US debt from its current AAA value. Official reasons given, one official says, will be the political confusion surrounding the process of raising the debt ceiling, and lack of confidence that the political system will be able to agree to more deficit reduction. A source says Republicans saying that they refuse to accept any tax increases as part of a larger deal will be part of the reason cited. The official was unsure if the bond rating would be AA+ or AA.
A third official says that S&P made a “serious mistake” in its analysis, “based on flawed math and assumptions,” so the Obama administration is pushing back. But even though “S&P has acknowledged its numbers are wrong, it’s unclear what they’re going to do.,” the official said.
But… but… I thought being able to borrow more money made the existing U.S. debt safer! Anyhow, I don’t think any government whose agencies have made the historical 2001 recession disappear, and whose unscheduled ex post facto revisions are nearly five times larger than the revised growth are in any position to claim anyone else is using “flawed math and assumptions”.
The worrisome thing is these are the agencies that still had Enron at AAA when it was going bankrupt. It boggles the mind to think how bad U.S. finances must be for the ratings agencies to actually notice.
UPDATE – The administration’s whining didn’t work:
– We have lowered our long-term sovereign credit rating on the United States of America to ‘AA+’ from ‘AAA’ and affirmed the ‘A-1+’ short-term rating….
– The outlook on the long-term rating is negative. We could lower the long-term rating to ‘AA’ within the next two years if we see that less reduction in spending than agreed to, higher interest rates, or new fiscal pressures during the period result in a higher general government debt trajectory than we currently assume in our base case.
Notice that nothing is said about the need to raise taxes. S&P knows as well as the American public that more taxes will only lead to more spending. And there will almost surely be less reduction in spending than agreed to, given that this has been the case following practically every budget deal of the last 31 years.
As I wrote several times prior to the hike in the debt ceiling, increasing the amount of debt doesn’t make default less likely, it makes it MORE likely.
Derek Thompson of the Atlantic considered these four charts from Calculated Risk to the be scariest economic charts he’s seen all year. I can only conclude that he has not seen the following chart, which shows the “credit gap” between where the U.S. economy would be if credit growth had simply proceeded at its 50-year post-WWII average and where it actually stands after Q1-2011. The chart shows, in no uncertain terms, how completely unprecedented the situation is, and also demonstrates that the scale of the problem is much, much larger than is presently indicated by the various employment, production and consumption statistics.
Nor, I presume, has he seen the chart that accompanied it in last week’s column, which shows how the composition of that stagnant debt has been shifting since 2008.
This chart explains the reason behind the determination of both political parties to raise the debt ceiling, as federal debt HAS to continue to increase, and increase significantly, in order to make up for the ongoing contractions in the private debt sectors, which so far has amounted to $600 billion in the Household sector and $3 trillion in the Financial sector. The truly frightening thing is that it is perfectly possible for the Financial sector debt to contract much more severely; it grew from 0.85% of total debt in 1946 to 32.7% in 2008 and presently stands at 25.23%. Considering what $3 trillion in debt-deleveraging has done to date, imagine how much more economic pain would be involved in an additional $13.8 trillion contraction.
As Steve Keen has chronicled since 2005, the mainstream economists are still paying absolutely no attention to these apocalyptic signs because they consider debt to be “exogenous” to their system models. Paul Krugman’s words in his latest paper are straight out of Paul Samuelson’s 1948 textbook.
“Ignoring the foreign component, or looking at the world as a whole, the overall level of debt makes no difference to aggregate net worth — one person’s liability is another person’s asset.“ – (Paul Krugman and Gauti B. Eggertsson, 2010, pp. 2-3)
Of course, this gives us a clear warning with regards to how The Masters of the Universe are going to try to fix the problem. Big it up and centralize it. Since the U.S. inability to pay back its foreign debt is becoming increasingly obvious, the answer will be to “look at the world as a whole”, or convert a national economy into a global one in which the national debt no longer counts because “one person’s liability is another person’s asset”. As long as the macro accounting all balances, how could there possibly be any problem? And since the European Union has shown that the stresses of monetary union cannot survive without political union to enforce austerity programs and forced transnational redistributions, this means global governance will be a necessary, indeed integral, part of the mainstream economic program.
Because, after all, forcibly installing a one-world government makes so much more sense than simply replacing your inoperative and outdated economic model with one that actually works!
The U.S., rated Aaa since 1917, was placed on negative outlook, Moody’s said in a statement today as it confirmed the rating after President Barack Obama signed into law a plan to lift the nation’s borrowing limit and cut spending. A decision on the rating may be made within two years, or “considerably sooner,” according to Moody’s Steven Hess.
The debt-limit compromise “is a positive step toward reducing the future path of the deficit and the debt levels,” Hess, senior credit officer at Moody’s in New York, said in a telephone interview. “We do think more needs to be done to ensure a reduction in the debt to GDP ratio, for example, going forward.”
When I published RGD in 2009, I don’t remember anyone being concerned about debt levels except Credit Suisse and a few Austrian economists talking about Debt/GDP. It is a subject that few Neo-Keynesian or Monetarist economists are equipped to understand because it simply doesn’t factor into their models. Even those few prognosticators who are recognized for anticipating the 2008 crash, like Nouriel Roubini, didn’t start talking much about it, (except occasionally for the Japanese situation), until the middle of 2010. So, it’s interesting to see that it’s now being actively discussed in mainstream financial media outlets such as Bloomberg.
However, they’re still only looking at Federal debt to GDP rather than the more important figure of total debt to GDP. Keep in mind that it would be highly unusual for Moody’s to actually do any serious downgrading until it is already completely apparent in the credit markets. The ratings agencies are usually three days late and millions, if not billions, of dollars short.
If I sounded a little less than fluid in the interview with CTV yesterday, the reason is, ironically enough, that the two Canadian producers prepared me extraordinarily well for it. I was very impressed with their thoroughness and the quality of their questions; I’ve been on a number of national news shows before and I’ve never seen anything like it. After a 30-minute pre-interview going over the debt ceiling debate and how it related to some of the concepts in RGD with one of the producers the day before, I produced two charts that we both thought would be useful as well as nicely visual, after which I was sent me the six questions I was to anticipate.
However, there was just a bit of a curve ball in the interview itself. Not only did they use a different picture than the one I provided, (understandably, since they must have wanted color), and they didn’t make use of the charts I made, (which was fine, I used them in today’s column), but some of the questions asked by the anchor were somewhat different than the ones I’d been provided. Her questions weren’t bad ones, by any means, but they were just far enough afield so I didn’t have the statistics on things like “historical tax revenue as a percentage of GDP” immediately to hand.
Note that I’m not complaining here, merely observing how the process was very different than my experience with American TV and radio.
Anyhow, I found that I was thinking “wait, what?” the entire time I was trying to answer the anchor’s questions. “Did I mishear that? Am I even answering the right question?” Anyhow, since I thought the producer’s questions were pretty good ones and I prepared for them, I thought I might as well post my notes for the interview here.
You recently wrote in an article that the issue is not so much the debt ceiling, but the debt itself. Can you explain exactly why?
The U.S. federal government has spent three years keeping the economy artificially propped up by substituting $4.1 trillion in new government debt for $3.6 trillion in household and financial sector debt-deleveraging. Washington cannot keep playing ostrich without raising the debt ceiling. The reason you’ve seen the number $2.4 trillion bandied about is because that buys them another six quarters at the current rate of $365 billion in new debt per quarter, enough to get them past the 2012 elections. But all this accomplishes is to delay the day of reckoning and increase the eventual cost. Since the housing market and employment numbers have actually gotten worse during this period of extend-and-pretend, it should be clear that raising the debt ceiling isn’t even a potential fix for the problem.
In your book you look at the patterns that led to the Great Depression, and the Heisei boom In Japan that led to it’s famous ‘lost decade”- and you believe it will happen again, only this time it will be worse. What leads you to believe this?
First, the debt-to-GDP ratio is worse than it was in the Great Depression or Japan in 1999. It was 2.6 in 1933, it peaked at 3.7 in 2008 and it is 3.5 now. Second, in the 1930s, it was only the USA that attempted to fight the post-1929 economic contraction with Keynesian stimulus policies and only the USA suffered a Great Depression. In England, the contraction stopped in 1932, France never saw double-digit unemployment, and the Japanese economy was actually enjoying significant growth.(1) This time, Europe, China, and Japan all followed the US lead and applied their own stimulus plans in 2009, which we are already seeing is now in the process of backfiring on everyone.
In a chapter of your book entitled “No one knows anything” you explain that many of the governments calculations for GDP are misleading that they contain wide margins for error and cannot be trusted- why is that?
Because they’re verifiably wrong. Look at the recent first quarter. All three reports, from Advance to Final, had U.S. GDP growth at 1.8 to 1.9%. Then, in the second quarter report, there is an inexplicable revision from 1.9% to 0.4%. That’s a $225 billion mistake, which is almost five times more than the $60 billion growth now being reported. These revisions are so out of control that if you bother to look back at the 2001 numbers, you’ll see that the 2001 recession has been revised out of existence. It’s complete fiction. On the employment side, the game is to not count people who don’t have jobs as unemployed. That’s why they claim the unemployment rate is only 9.2% when it’s really closer to 20%.
You say that a boom fuelled by easy credit must be followed by a bust of equal size and duration. Instead, it has been FED policy to re-inflate bubbles and they collapse, which only creates bigger bubbles- You say we are currently in the biggest bubble yet- what could pop it?
What will pop it is a reduction in the rate of growth of government spending, an increase in interest rates, or a major sovereign investor’s refusal to continue buying Treasury bonds. Any of the three will suffice to put the USA into a debt-deleveraging spiral. The problem with depending upon debt-based economic growth is that eventually, you run out of people who are willing and able to borrow money. And that’s when the contraction starts.
There is a large backlog of home foreclosures in the United States- what would happen if that backlog were to suddenly be cleared? Are there other potential triggers out there?
Clearing the backlog would put the economy into the equivalent of heart failure because it would instantly kill a lot of banks. The $600 billion decline in household sector debt is deceptively small because over 7.5% of all mortgages have been delinquent for more than 90 days. The banks aren’t writing those bad loans off yet because to do so would bankrupt them. Based on the FDIC statistics, I estimate that about $3 trillion of the $7.5 trillion in assets presently claimed by the big four, Bank of America, Citi, Wells Fargo, and JP Morgan Chase, are worthless.
What are the options for the global economy- what are the best and worst case scenarios?
Pay a high price now, or pay a higher price later. Deflation, default, and economic contraction aren’t fun, but they are perfectly survivable. The best case scenario is we go through the global equivalent of the Great Depression, what I’ve called Great Depression 2.0. It will be very difficult for a lot of people, but the basic governmental structures will survive and there won’t be cannibalism in the streets or anything like that. The worst case is that the politicians keep kicking the can down the road until the entire global financial system finally collapses overnight. In that case, we’re probably going to see wars, civil wars, and fundamental change of the sort most of us find impossible to imagine.
(1)thanks to the invasion of Manchuria, of course, but the GDP statistics are what they are.
“At the White House and in talks in congressional offices and corridors, most of the attention was focused on finding a way to define the precise conditions under which the president could get a second increase in the debt limit that would be needed early in 2012 under both Republican and Democratic proposals.” – “Amid New Talks, Some Optimism on Debt Crisis,” The New York Times, July 30, 2011
It’s not hard to understand why the leaders of both political parties are vehemently opposed to the possibility of U.S. default. But as many commentators, including myself, have pointed out for weeks, a failure to raise the debt ceiling has absolutely nothing to do with the possibility of a sovereign U.S. default! In fact, raising the debt ceiling will make a default much more likely in the future. So why are the politicians, particularly Barack Obama, so desperate to see some sort of deal struck that will permit the raising of the $14.3 trillion federal debt ceiling?
NB – This column was written prior to the announcement of the “compromise” plan, which Karl Denninger summarized as below. Nothing in it changes anything substantive regarding the column.
1. Lie once again about “cutting spending.” It does no such thing. It increases spending – every year. Bogus and outright-fraudulent “baseline budgeting” means that if they intended to boost spending $300 billion but only increase it $200, that’s a $100 billion “cut.” If you ran your household like this you’d be broke in a week. For the US, it will take a bit longer.
2. No tax increases. That’s nice, but let’s not forget that while the Democrats scream about the “Bush Tax Cuts” the FICA tax cut was theirs. Obama signed it. You cannot keep reducing income and increasing spending forever.
3. The cuts, fraudulent though they are, aren’t even real anyway – and not binding either. There’s nothing before 2013, which means a downgrade is almost certain. Further, raising the debt ceiling now for the whole among but allegedly finding the “cuts” over 10 years is an outright fraud by a ratio of 10:1.
4. A 2013 timeline for actual changes means nothing, since the next Congress is not bound by what this one does. Period.
5. Sequesterization didn’t work in 1997. It won’t work in 2011 either.
6. We failed to get to $4 trillion. That’s what S&P said they needed, and they said they needed to see that within the next three years. Now we find out if S&P has any balls.
NRO reports: “According to sources, Boehner said the deal was “the best that we could get.”” And that is perhaps the most shameful thing about this whole bipartisan charade. The scriptwriters couldn’t even bother to write new dialogue for Republicans Cave on the Budget XXXI.
Unsurprisingly, it has all turned out to be fake. The choice being presented for public consumption is one between fake spending cuts (Republican) versus non-existent spending cuts (Democrat). Of course, the real issue is the need to keep spending in order to continue the appearance of economic stagnation. Ask yourself this question. What is the magic in the $2.4 trillion addition to the $14.3 trillion debt ceiling?
Answer: $365 billion. That is the average increase in federal debt per quarter since the middle of 2008. $2.4 trillion is six quarters worth of that… which is sufficient to see the current set of politicians safely past the 2012 elections. Assuming that the private sector continues its debt-deleveraging, this means that by the end of 2012, government will account for 27.8% of all debt, the federal government will account for 23.2% of it (up from 10.3% in Q2-2008), households will be at 22.4% (down from 28%) and the financial sector at 24.4% (down from 31.5%).
Speaking of the debt limit, if you happen to be Canadian, I’ve been asked to appear on their 24-hour news channel, CTV, to discuss it. If you are not Canadian, but happen to be so inclined, you can watch the clip here.
I’ve been having some disturbing conversations with both finance people and Washington people over the last few days, that have only confirmed the disconnect I wrote about a few weeks ago. Each side is sending signals that the other side is not reading correctly. And this is getting more dangerous by the hour.
The core fact is that markets haven’t sold off nearly as much as you’d expect if Wall Street were really freaking out. This is not because Washington pols have told their Wall Street paymasters about a secret deal that just hasn’t reached the ears of those of us reporting from down here. Nor are they calm because they think that a failure to raise the debt ceiling will be no big deal. They certainly don’t believe that a forced spending cut of 40% will somehow make us extra-super-more-likely to make us pay off our debt.
No, they’re relatively calm because they simply cannot bring themselves to believe that we’re not, in the end, going to raise the ceiling. It’s too outlandish that we would, through the collective action of our congressmen, suddenly and for no apparent reason shoot ourselves in the head.
This is sound reasoning, as far as it goes. But it doesn’t get you very far. They’re deriving a theory of the debt ceiling like Aristotle, from first principles rather than data. In general, my non-representative sample of people working on or near Wall Street is that they are now noticeably more sanguine about the prospects for a deal than people working in the city where the deal is going to get made….
Meanwhile, just as Wall Street doesn’t have much insight into what’s going to happen in Washington over the next week, I don’t think Washington really understands what will happen in the markets. I think Stan Collender is right: Washington, particularly the GOP bit of it, is interpreting Wall Street’s lack of a reaction as a sign that it’s maybe not such a big deal to breach the debt ceiling. But the real message Wall Street is sending is “You can’t be serious! Not raising the debt ceiling would be a disaster!”
This is an impressive failure to comprehend the obvious. First, what McCardle doesn’t understand is that it is raising the debt ceiling that would be a disaster. The ratings agencies are not warning everyone that a failure to make a deal to raise the debt ceiling will lead to a reduction in the quality rating of U.S. debt, but that a failure to provide the $4 trillion in spending cuts that were mentioned as part of a deal will lead to the aforementioned ratings downgrade.
While a failure to raise the debt ceiling will certainly have negative consequences for stock prices and GDP statistics, this helps the long-term prospects for the ability of the U.S. to raise funds in the future. And second, the relative lack of panic over the rapidly approaching “deadline” is not due to any false signal readings, but rather the fact that the deadline is an artificial and meaningless one.
As for what Wall Street wants, the answer is obvious. More money, more debt, more inflation. That doesn’t mean that what Wall Street wants is relevant, good for the economy, or good for the American people. In fact, it’s usually a reliable indicator of what is bad for everyone but Wall Street. Concerning Washington, they know perfectly well the debt ceiling will be raised. After all, the only thing that really stands in the way is for Republicans to crumble, which they are doing as expected.
House Republicans are rallying behind House Speaker John Boehner’s (R., Ohio) deficit reduction plan, believing that is it their best available option to raise the debt ceiling and cut spending. During a Wednesday morning conference meeting, Boehner told members to “get your ass in line” and support his plan. “This is the bill,” he said. “I can’t do this job unless you’re behind me.” If the bill passes the House, the speaker predicted, Senate Democrats and President Obama would “fold like a cheap suit.”
Notably, Rep. Jim Jordan (R., Ohio), chairman of the Republican Study Committee, opened the meeting by apologizing for a series of e-mails sent by an RSC staffer urging outside groups like Club for Growth and Heritage Action to pressure undecided members to oppose the plan. Rank-and-file members, many of them members of the RSC, were none too pleased to find themselves on the list of targets. There were several calls for the offending staffer to be fired. Much of the meeting was devoted to the controversy, which merely underscores the intra-party tension that has been simmering over the past several weeks.
Meanwhile, however, the opposition bloc led by Jordan appears to be crumbling, as leadership’s message seems to be sinking in. Sources tells NRO that a number of members who were confirmed no votes against the Boehner plan announced during the meeting that they would be voting yes.

