It’s easy to get distracted by the floundering of the critics, but those who have read and understood Probability Zero and The Frozen Gene are already beginning to make profitable use of them. For example, CN wanted to verify my falsification of Kimura’s fixation equation, so he did a study on whether N really was confirmed to be reliably different than Ne. His results are a conclusive affirmation of my assertion that the Kimura fixation equation is guaranteed to produce erroneous results and has been producing erroneous results for the last 58 years.
I’ll admit it’s rather amusing to contrast the mathematical ineptitude of the critics with readers who actually know their way around a calculator.
The purpose of this analysis is to derive a time‑averaged census population size, Navg for the human lineage and to use it as a diagnostic comparator for empirically inferred effective population size Ne.
The motivation is that Ne is commonly interpreted—explicitly or implicitly—as reflecting a long‑term or historical population size. If that interpretation is valid, then Ne should be meaningfully related to an explicit time‑average of census population size Nt. Computing Navg from known census estimates removes ambiguity about what “long‑term” means and allows a direct comparison.
Importantly, Navg is not proposed as a replacement for Ne in population‑genetic equations. It is used strictly as a bookkeeping quantity to test whether Ne corresponds to any reasonable long‑term average of census population size or not.
Definition and derivation of Navg
Let Nt denote the census population size at time t, measured backward from the present, with t=0 at present and T>0 in the past.
For any starting time ti, define the time‑averaged census population size from ti to the present as:
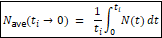
Because Nt is only known at discrete historical points, the integral is evaluated using a piecewise linear approximation:
- Select a set of times at which census population estimates are available.
- Linearly interpolate Nt between adjacent points.
- Integrate each segment exactly.
- Divide by the total elapsed time ti
This produces an explicit, reproducible value of Navg for each starting time ti.
Census anchors used
- Census population sizes Nt are taken from published historical and prehistoric estimates.
- Where a range is reported, low / mid / high scenarios are retained.
- For periods of hominin coexistence (e.g. Neanderthals), census counts are summed to represent the total human lineage.
- No effective sizes Ne are used in the construction of Nt.
Present is taken as 2026 CE.
Results: Navg from ti to present
All values are people.
Nti is the census size at the start time.
Navg is the time‑average from ti to 2026 CE.
| Start time ti | Years before present | Nti (low / mid / high) | Navg(ti – present) (low / mid / high) |
| 2,000,000 BP (H. erectus) | 2,000,000 | 500,000 / 600,000 / 700,000 | 2.48 M / 2.86 M / 3.24 M |
| 50,000 BCE (sapiens + Neanderthals) | 52,026 | 2.01 M / 2.04 M / 2.07 M | 48.5 M / 60.6 M / 72.7 M |
| 10,000 BCE (early Holocene) | 12,026 | 5.0 M / 5.0 M / 5.0 M | 198 M / 250 M / 303 M |
| 1 CE | 2,025 | 170 M / 250 M / 330 M | 745 M / 858 M / 970 M |
| 1800 CE | 226 | 813 M / 969 M / 1.125 B | 2.76 B / 2.83 B / 2.90 B |
| 1900 CE | 126 | 1.55 B / 1.66 B / 1.76 B | 4.02 B / 4.04 B / 4.06 B |
| 1950 CE | 76 | 2.50 B / 2.50 B / 2.50 B | 5.33 B (all cases) |
| 2000 CE | 26 | 6.17 B / 6.17 B / 6.17 B | 7.24 B (all cases) |
Interpretation for comparison with Ne
- Navg is orders of magnitude larger than empirical human Ne, typically ~10(4) for all plausible averaging windows.
- This remains true even when averaging over millions of years and even under conservative census assumptions.
- Therefore, Ne cannot be interpreted as:
- an average census size,
- a long‑term census proxy,
- or a time‑integrated representation of Nt
The comparison Navg > Ne holds regardless of where the averaging window begins, reinforcing the conclusion that Ne is not a demographic population size but a fitted parameter summarizing drift under complex, non‑stationary dynamics.
Kimura’s cancellation requires N = Ne. CN has shown that N ≠ Ne at every point in human history, under every averaging window, by orders of magnitude. The cancellation has never been valid. It was never a simplifying assumption that happened to be approximately true, it was always wrong, and it was always substantially wrong.
The elegance of k = μ was its selling point. Population size drops out! The substitution rate is universal! The molecular clock ticks independent of demography! It was too beautiful not to be true—except it isn’t true, because it depends on a variable identity that has never held for any sexually reproducing organism with census populations larger than its effective population. Which is all of them.
And the error doesn’t oscillate or self-correct over time. N is always larger than Ne—always, in every species, in every era. Reproductive variance, population structure, and fluctuating population size all push Ne below N. There’s no compensating mechanism that pushes Ne above N. The error is systematic and unidirectional.
Which means every molecular clock calibration built on k = μ is wrong. Every divergence time estimated from neutral substitution rates carries this error. Every paper that uses Kimura’s framework to predict expected divergence between species has been using a formula that was derived from an assumption that the author’s own model parameters demonstrate to be false.